How to Improve Your Home’s Energy Efficiency with Home IQ
by ecobee on 05/25/2021 in Smart Home & Tech
6 min read
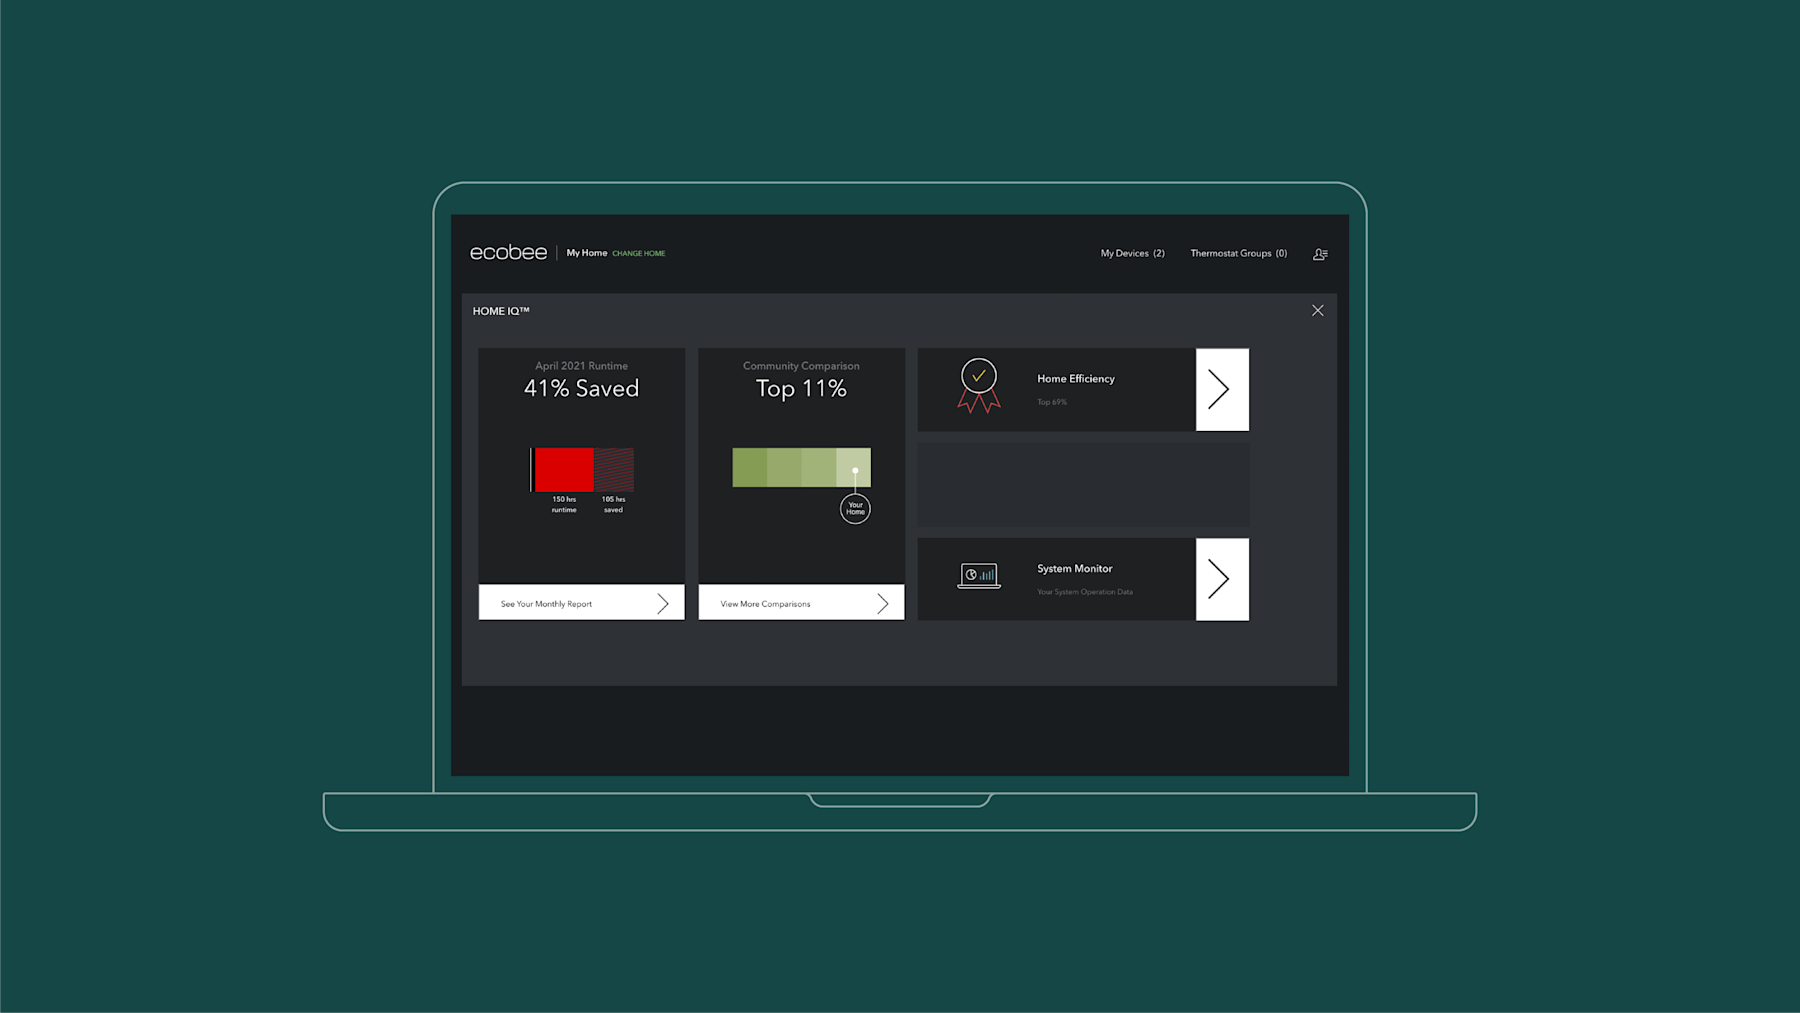
Have you taken advantage of Home IQ yet? This insightful tool gives you an in-depth look at how much money your ecobee thermostat helps you save on your energy bills and how to save even more.
Whether you want to know how efficient your home is, see how it compares with others in the community, or access all of your smart thermostat data—it’s all at your fingertips.
To open Home IQ, sign in to the web portal and select Home IQ. (If you have multiple thermostats, each one will have its own Home IQ report.)
Here are five ways you can use Home IQ to save more with your ecobee thermostat:
1. See how much you’re saving with monthly runtime reports.
It takes a lot of energy to heat and cool your home. While a conventional thermostat maintains the same indoor temperature all of the time, your ecobee thermostat saves money and reduces power consumption by running your HVAC equipment less when you are asleep or away.
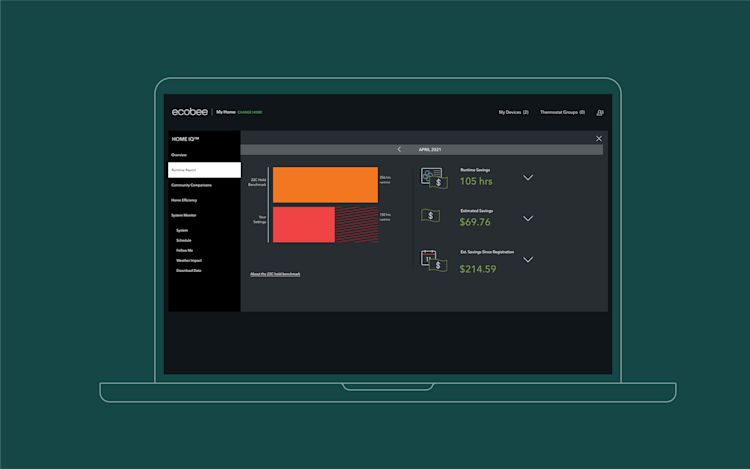
The Runtime Report shows you how much energy your ecobee saves each month compared to a conventional thermostat.
How it works: In the example below, the red bar shows you how long your HVAC system ran in a given month. The wider, orange bar shows you how long your equipment would have run if you replaced your ecobee with a conventional thermostat and left your home at a steady 72°F (22°C) year-round.
Show me the money.
ecobee runtime reports also show you how much money you saved since you first installed your thermostat, as well as your monthly savings. Your estimated savings are based on the cost of energy in your area.
In the example above, the ecobee thermostat used the HVAC equipment 105 fewer hours than a conventional system would have, for a monthly savings of $69.76.
Tip: See how much you saved in previous months with the month toggle.
2. Compare your monthly savings to the average savings in your area.
For some friendly competition with your neighbors, dive into Community Comparisons, which takes your ecobee runtime savings and temperature preferences and compares them to the average in your state or province.
The top half of the Community Comparisons screen shows you how your monthly energy savings compare with the provincial average. The closer you are to the right of the scale, the better you’re doing.
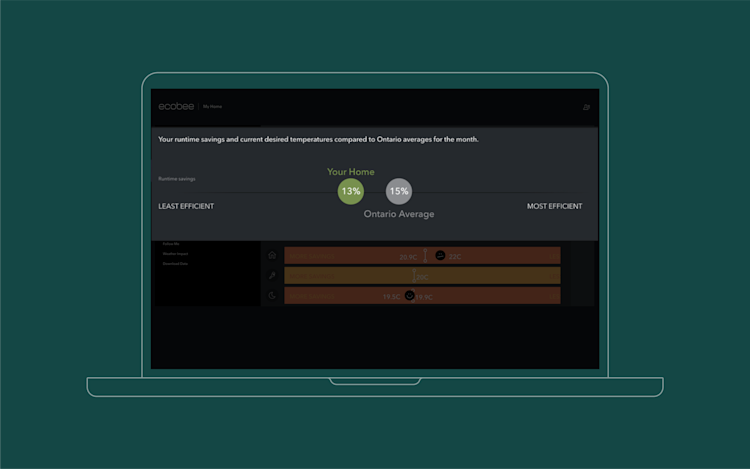
In the example above, the owner’s runtime savings (13 percent) trail the state or provincial average, indicating that there may be room for improvement.
Tweak your Comfort Settings for more savings.
The second part of Community Comparisons gives you a more descriptive breakdown based on your Comfort Settings. The color-coded horizontal bars show how your Home, Away, and Sleep temperature preferences compare to the state or provincial average.
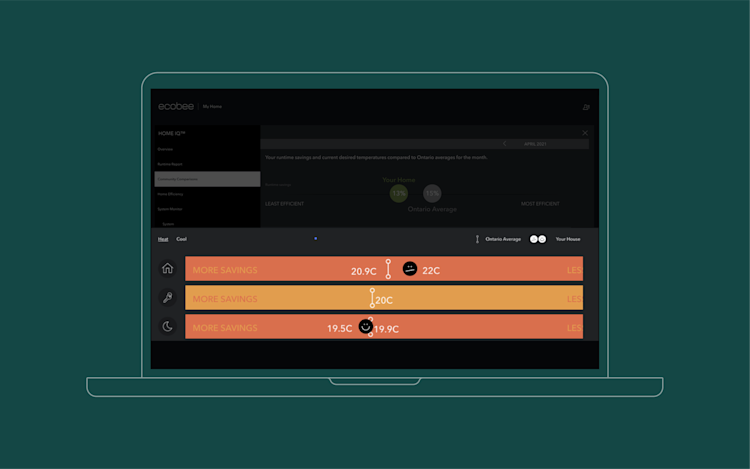
A smiley emoji means you are on the right track, saving as much or more than the state or provincial average for that Comfort Setting. But a sour-faced emoji means you may be able to unlock additional energy savings by adjusting your desired temperature.
For example, if your desired temperature when you are home is higher than the average (like in the example above), you can lower it to access more savings and turn that frown upside down.
Tip: Use the Community Comparisons feature to see if your home needs energy efficiency improvements or is already at the top of its game.
3. See how efficient your home is compared to the community.
Use the Home Efficiency tab to see how energy efficient your home is compared with others your state or province. Similar to Community Comparisons, the higher your percentage, the better you're doing.
When it comes to the energy efficiency of your home, we're talking about how well it retains thermal energy:
- How quickly it heats up and cools down.
- How long it can hold the desired temperature without running the equipment.
How can I improve my home’s energy efficiency?
If your home gets a low score, you can improve its energy efficiency and lower your heating and cooling costs by as much as 15% by sealing air leaks and adding insulation, per these Energy Star® recommendations.
4. Get more valuable insights with System Monitor.
System Monitor is a set of charts that give you a granular look at your home’s heating and cooling patterns. You can even download several months of runtime data to see how your home heating and cooling patterns change with the seasons.
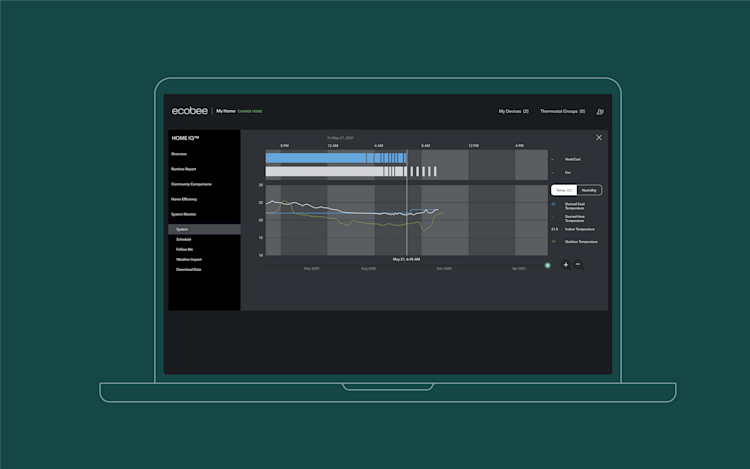
How to use System Monitor graphs.
- The System graph (pictured above) shows a range of factors, including the actual and desired indoor temperature, the outdoor temperature, and humidity levels. The orange or blue bars at the top represent when the heating or cooling equipment ran and for how long.
Want to see the temperature at noon? As you drag your cursor or finger across the screen, the exact temperature and humidity levels throughout the day will appear to the right of the chart.
-
Schedule shows indoor temperatures, humidity levels, and when the different Comfort Settings (i.e., Awake, Away, and Sleep) in your daily schedule were in effect.
-
Follow Me is a handy graph for ecobee SmartOwners with SmartSensor. It shows you which rooms were occupied and for how long, the temperature in each room, and the average home-wide temperature.
-
While the System, Schedule, and Follow Me charts show activity over a 24-hour period, Weather Impact shows how the weather outside affects your HVAC system's performance over a month.
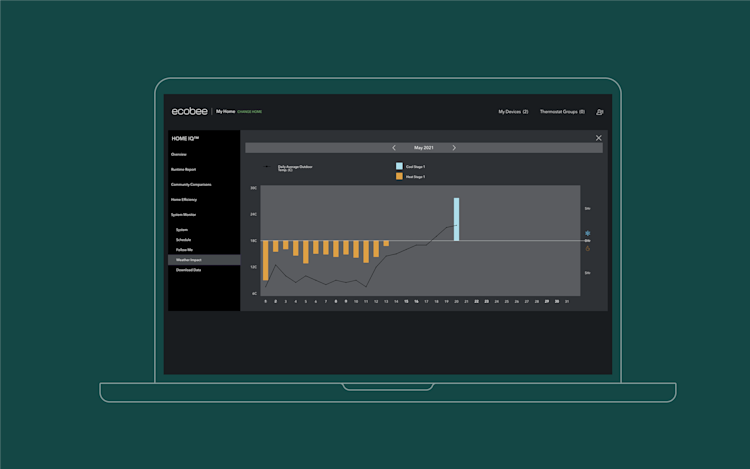
The black line on the graph above represents the average outdoor temperature for each day of the month. The colored bars indicate how long your heating equipment (orange) or cooling equipment (blue) ran on each day. The longer the bar, the longer the equipment ran.
In the example above, the heating equipment ran for over 5 hours on May 1, a monthly high.
5. View your thermostat data in your favorite spreadsheet application.
Your thermostat data belongs to you. To export it, click the Download Data tab on the left-hand column of the System Monitor. Next, pick a date range and download your energy history as a .csv file. You can now open your thermostat data as a spreadsheet.
Now that you have everything you need to get started with Home IQ, here are 10 more easy ways to optimize your smart thermostat for energy savings and comfort.
Did you enjoy this article?
Thanks for letting us know!

