Energy at Your Fingertips: How to Use Home Energy Reports in the ecobee App
Monitor your heating and cooling system, identify potential issues, and compare your energy consumption with others in your community.
by ecobee on 12/12/2024 in News
3 min read

Did you know that Home Energy Reports , previously known as HomeIQ, is now available on your ecobee app? Home Energy Reports is a brand-new app experience for ecobee smart thermostat users that lets you quickly access and easily understand your energy usage and savings.
We spoke with Jimmy Gambier, a product manager on the mobile team, to get the inside scoop.
“When we ask users what features they want to see, time and again the most requested feature from customers was to see their energy usage in the ecobee app instead of having to log in to the website. The new experience we’ve built is more accessible and more intuitive to use,” said Gambier.
“The new experience we’ve built is more accessible and more intuitive to use.”
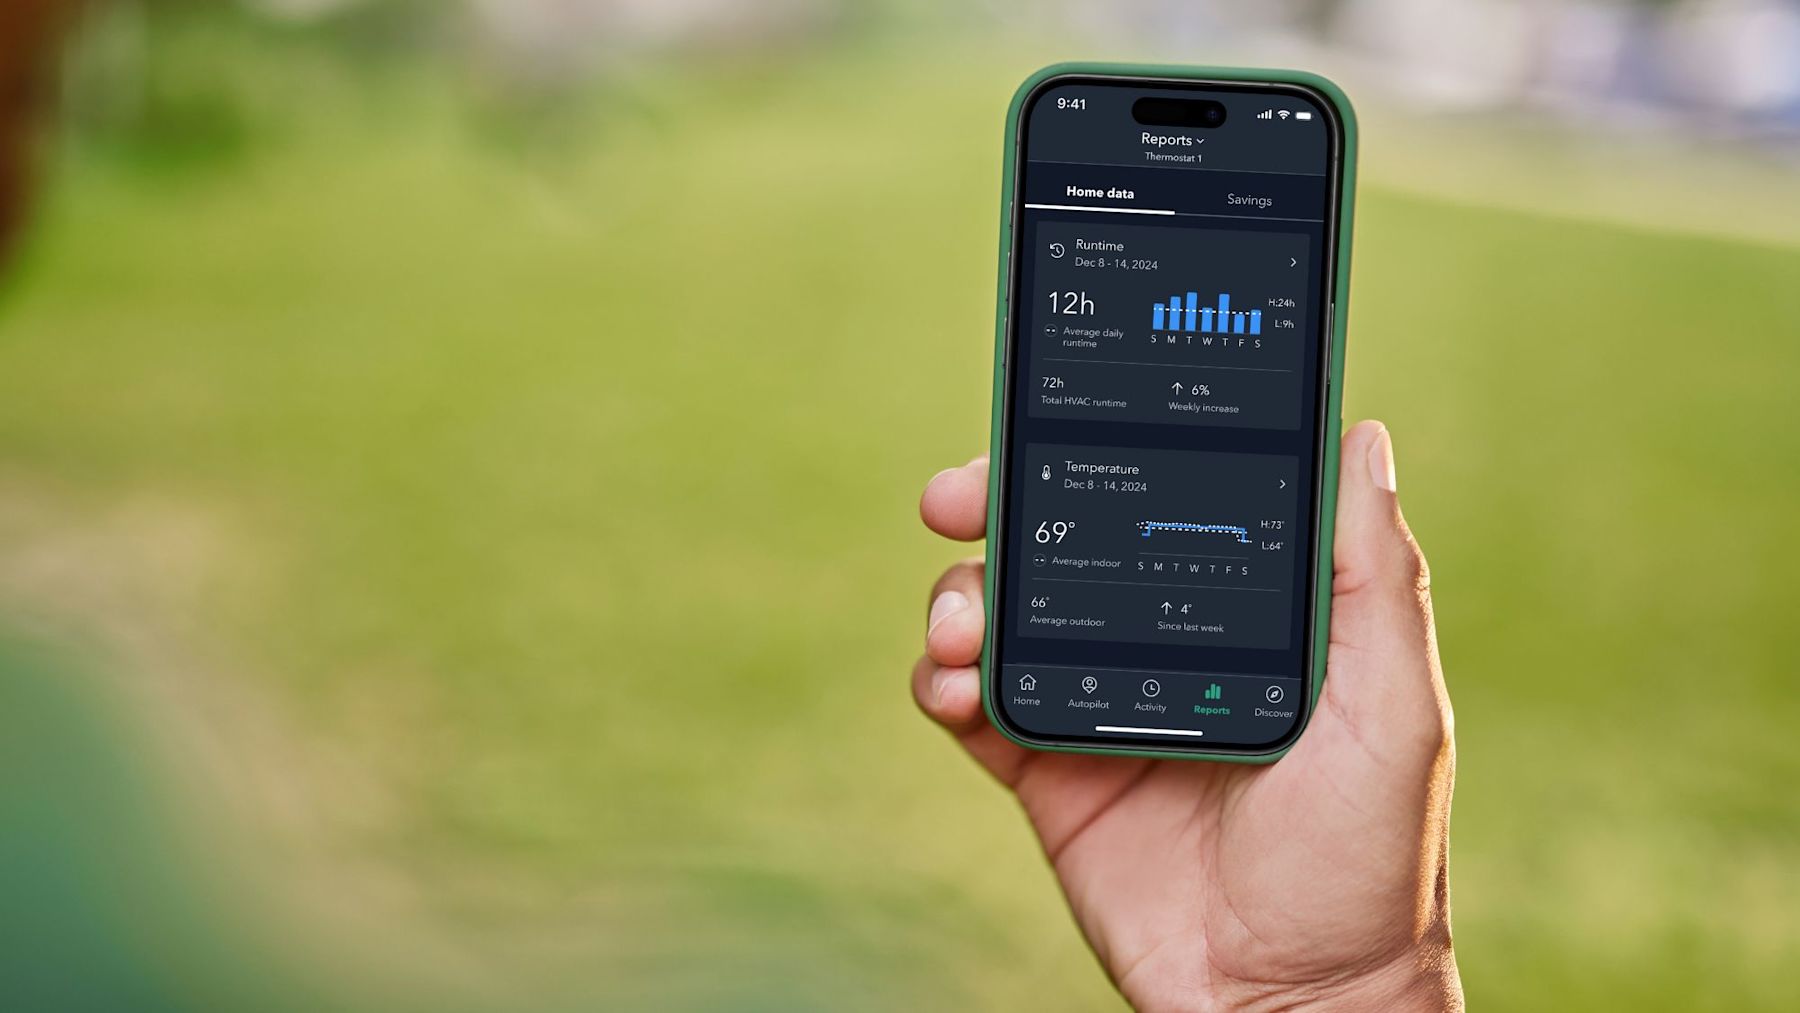
Getting started with Home Energy Reports is easy. If you are running the latest version of the ecobee app on iOS and Android, you will see that a new “Report” tab has been added on the bottom of the screen. This update is part of several recent improvements, including the relocation of the Vacation feature to the Account Settings section in the top navigation bar on the Home screen. Tap on the “Report” tab to open Home Energy Reports.
“The new Reporting tab makes it easy to understand what your heating and cooling system is doing, observe trends, identify trends when somethings wrong, and compare your energy savings and efficiency with the community,” said Gambier.
Within the Reports tab, you will find two sub tabs—one dedicated to home data and another for savings. The Home Data tab offers a deep dive into your daily habits, showcasing average and total runtime, all beautifully broken down into bar graphs. This feature makes it easy to track whether your heating and cooling usage is climbing or falling, empowering you to take control of your energy consumption. Plus, you'll get the same detailed insights for temperature and humidity, allowing you to compare your indoor comfort with the weather outside.
You can also drill into the information to see your usage on a day, week, or monthly basis and pinpoint when exactly your heating or cooling was running.
The Savings tab brings your energy efficiency to life with a color-coded comparison bar that lets you see how your home’s energy efficiency stacks up against others in your neighborhood. You'll also discover a comparison of your runtime savings versus the state or provincial average, giving you a clear picture of where you stand. All of this is updated monthly, and you can easily go back and select any month to dive into what matters most to you.
These innovative features not only provide a detailed view of your energy usage but also empower you to make smarter, more sustainable choices for your home. By seamlessly blending insightful data with user-friendly visuals, you can easily monitor and improve your energy efficiency to save money and help the environment.
Look for future updates, in which we'll be rolling out even more detailed charts, downloadable spreadsheets, and personalized recommendations.
Did you enjoy this article?
Thanks for letting us know!


